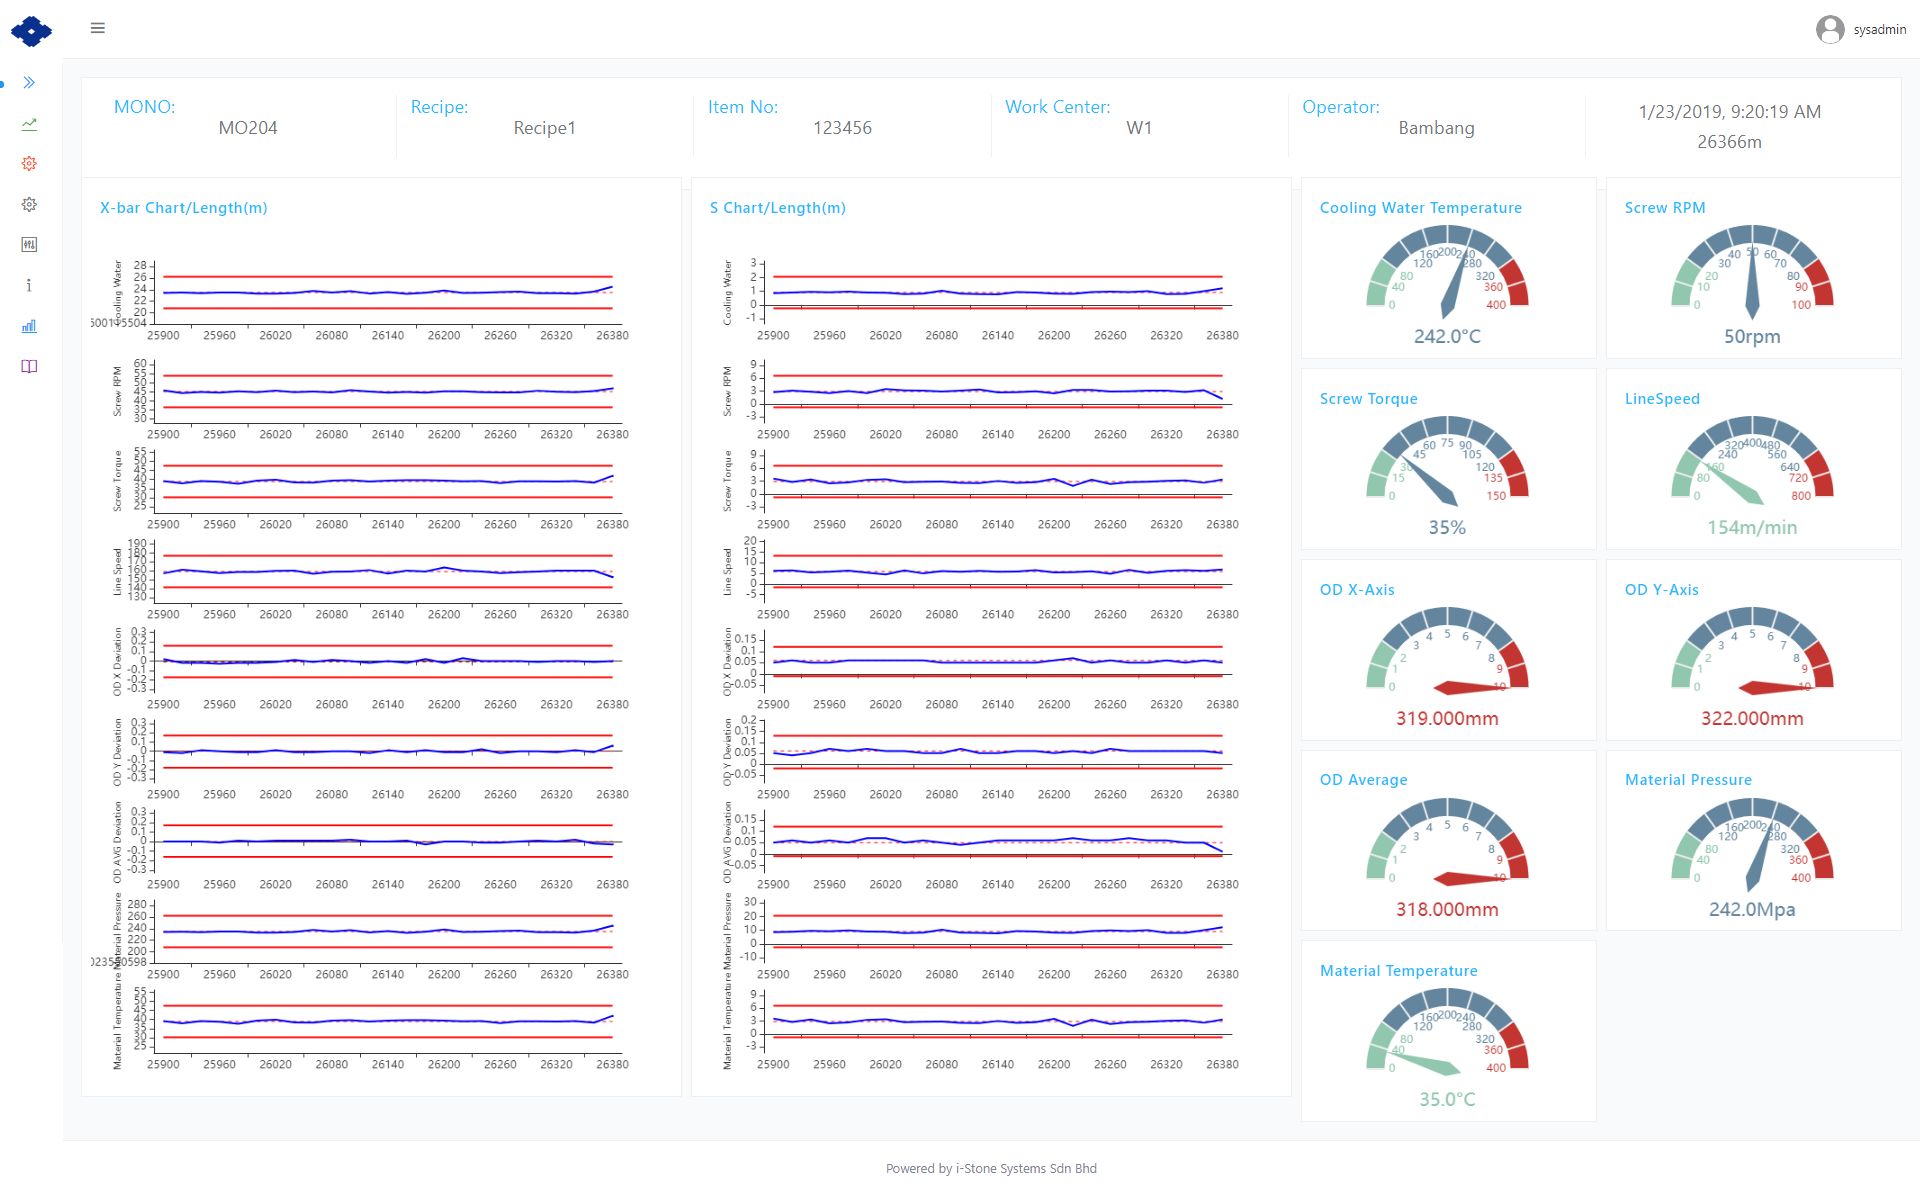
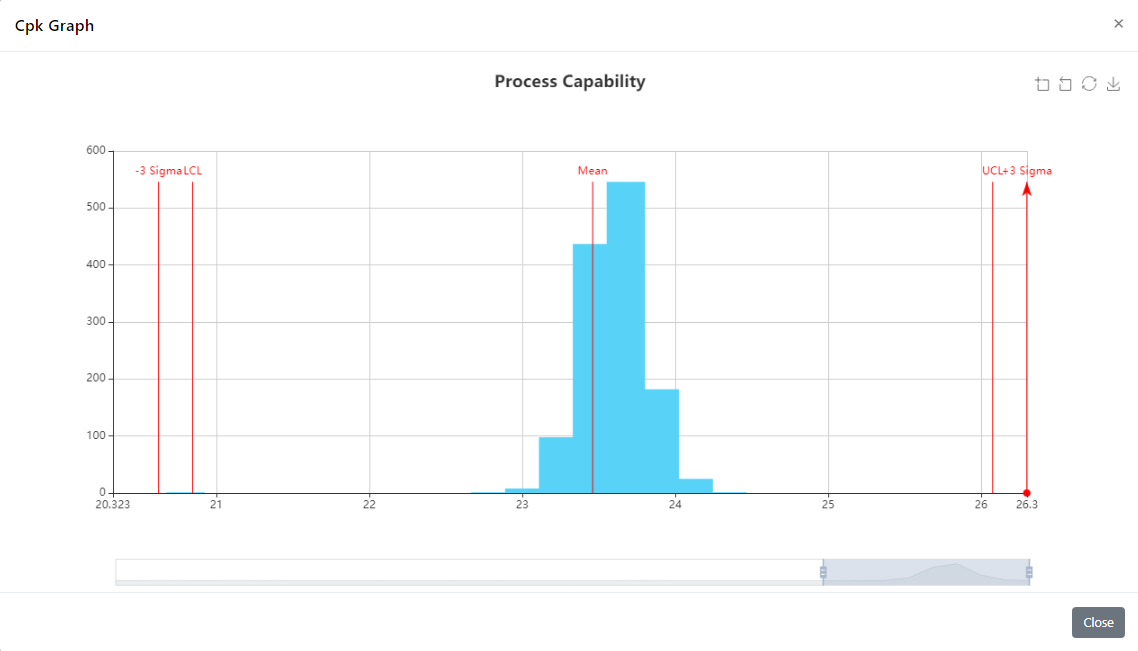
A control chart is a specialized time series plot designed to help identify abnormal patterns of variability in a process. However, many manufacturers find this information comes in too late for earlier intervention to prevent costly scrap. Our Real-Time SPC Module, on the other hand, instantly triggers manufacturers to quickly contain and fix defects through a suite of statistical charts and visualizations. In addition, it also enables manufacturers to set up email or text message alerts to stakeholders when entered data is out-of-control or out-of-spec.
i-MES SPC Module includes :-
- Real-time display and monitoring for SPC.
- Rolling SPC chart based on data collected from machines.
-
Automatic triggering:-
- Alarm and SMS/email notifications when out-of-control or out-of-spec occurs.
- Display outliers.
- Event log.
- Reset enabled.